python利用K-Means算法實(shí)現(xiàn)對數(shù)據(jù)的聚類案例詳解
目的是為了檢測出采集數(shù)據(jù)中的異常值。所以很明確,這種情況下的簇為2:正常數(shù)據(jù)和異常數(shù)據(jù)兩大類
1、安裝相應(yīng)的庫import matplotlib.pyplot as plt # 用于可視化from sklearn.cluster import KMeans # 用于聚類import pandas as pd # 用于讀取文件2、實(shí)現(xiàn)聚類2.1 讀取數(shù)據(jù)并可視化
# 讀取本地?cái)?shù)據(jù)文件df = pd.read_excel('../data/output3.xls', header=0)
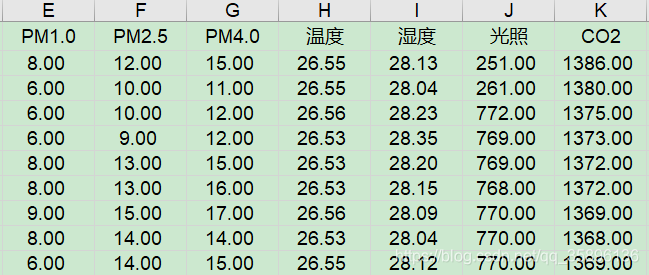
本次實(shí)驗(yàn)選擇溫度和CO2作為二維數(shù)據(jù),其中溫度含有異常數(shù)據(jù)。
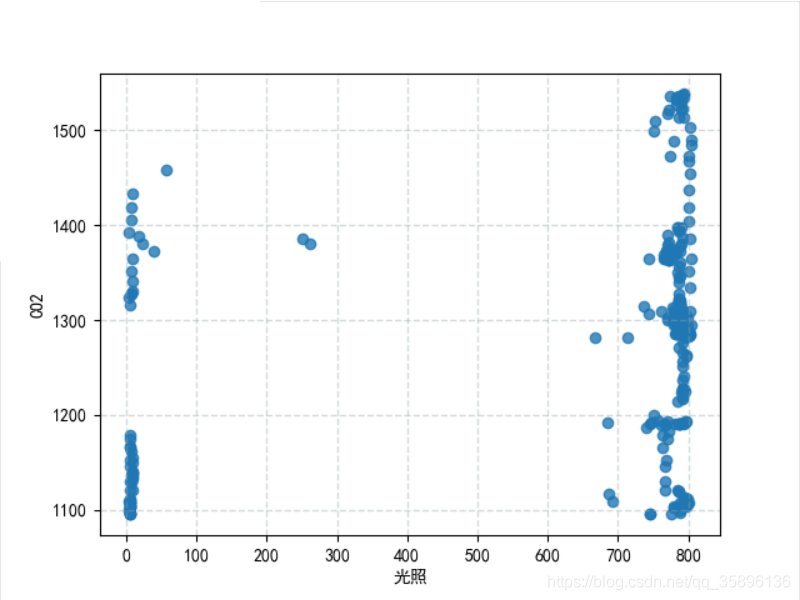
plt.scatter(df['光照'], df['CO2'], linewidths=1, alpha=0.8)plt.rcParams[’font.sans-serif’] = [’SimHei’] # 用來正常顯示中文標(biāo)簽vplt.xlabel('光照')plt.ylabel('CO2')plt.grid(color='#95a5a6', linestyle='--', linewidth=1, alpha=0.4)plt.show()
設(shè)置規(guī)定要聚的類別個(gè)數(shù)為2
data = df[['光照','CO2']] # 從原始數(shù)據(jù)中選擇該兩項(xiàng)estimator = KMeans(n_clusters=2) # 構(gòu)造聚類器estimator.fit(data) # 將數(shù)據(jù)帶入聚類模型
獲取聚類中心的值和聚類標(biāo)簽
label_pred = estimator.labels_ # 獲取聚類標(biāo)簽centers_ = estimator.cluster_centers_ # 獲取聚類中心
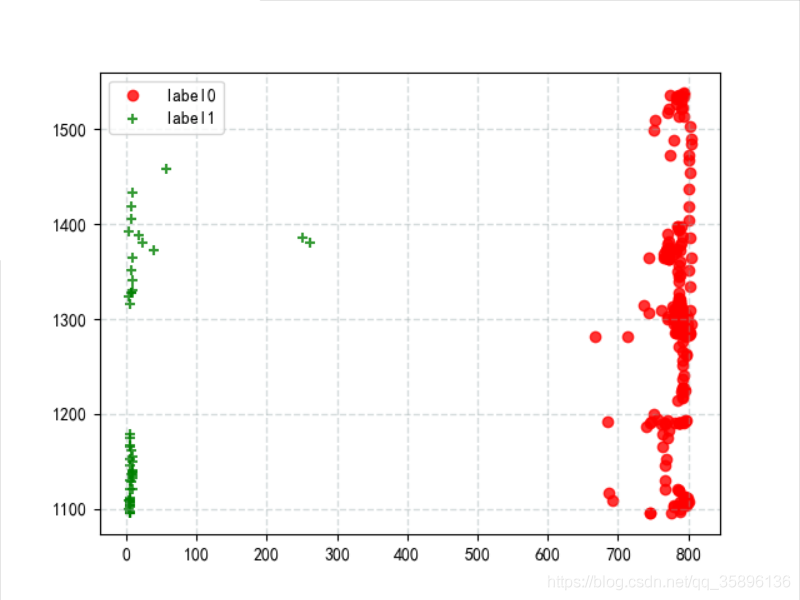
將聚類后的 label0 和 label1 的數(shù)據(jù)進(jìn)行輸出
x0 = data[label_pred == 0]x1 = data[label_pred == 1]plt.scatter(x0['光照'], x0['CO2'],c='red', linewidths=1, alpha=0.8,marker=’o’, label=’label0’)plt.scatter(x1['光照'], x1['CO2'],c='green', linewidths=1, alpha=0.8,marker=’+’, label=’label1’)plt.grid(c='#95a5a6', linestyle='--', linewidth=1, alpha=0.4)plt.legend()plt.show()
附上全部代碼
import matplotlib.pyplot as pltfrom sklearn.cluster import KMeansimport pandas as pddf = pd.read_excel('../data/output3.xls', header=0)plt.scatter(df['光照'], df['CO2'], linewidths=1, alpha=0.8)plt.rcParams[’font.sans-serif’] = [’SimHei’] # 用來正常顯示中文標(biāo)簽vplt.xlabel('光照')plt.ylabel('CO2')plt.grid(color='#95a5a6', linestyle='--', linewidth=1, alpha=0.4)plt.show()data = df[['光照','CO2']]estimator = KMeans(n_clusters=2) # 構(gòu)造聚類器estimator.fit(data) # 聚類label_pred = estimator.labels_ # 獲取聚類標(biāo)簽centers_ = estimator.cluster_centers_ # 獲取聚類結(jié)果# print('聚類標(biāo)簽',label_pred)# print('聚類結(jié)果',centers_)# predict = estimator.predict([[787.75862069, 1505]]) # 測試新數(shù)據(jù)聚類結(jié)果# print(predict)x0 = data[label_pred == 0]x1 = data[label_pred == 1]plt.scatter(x0['光照'], x0['CO2'],c='red', linewidths=1, alpha=0.8,marker=’o’, label=’label0’)plt.scatter(x1['光照'], x1['CO2'],c='green', linewidths=1, alpha=0.8,marker=’+’, label=’label1’)plt.grid(c='#95a5a6', linestyle='--', linewidth=1, alpha=0.4)plt.legend()plt.show()
到此這篇關(guān)于python利用K-Means算法實(shí)現(xiàn)對數(shù)據(jù)的聚類的文章就介紹到這了,更多相關(guān)python K-Means算法數(shù)據(jù)的聚類內(nèi)容請搜索好吧啦網(wǎng)以前的文章或繼續(xù)瀏覽下面的相關(guān)文章希望大家以后多多支持好吧啦網(wǎng)!
相關(guān)文章:
1. 前端html+css實(shí)現(xiàn)動(dòng)態(tài)生日快樂代碼2. 關(guān)于html嵌入xml數(shù)據(jù)島如何穿過樹形結(jié)構(gòu)關(guān)系的問題3. 不要在HTML中濫用div4. 初試WAP之wml+ASP查詢5. WMLScript的語法基礎(chǔ)6. CSS3實(shí)例分享之多重背景的實(shí)現(xiàn)(Multiple backgrounds)7. XML 非法字符(轉(zhuǎn)義字符)8. el-input無法輸入的問題和表單驗(yàn)證失敗問題解決9. XML入門的常見問題(三)10. JSP取得在WEB.XML中定義的參數(shù)
 網(wǎng)公網(wǎng)安備