Python figure參數(shù)及subplot子圖繪制代碼
1. Python的figure參數(shù)主要有:
def figure(num=None, # autoincrement if None, else integer from 1-N figsize=None, # defaults to rc figure.figsize dpi=None, # defaults to rc figure.dpi facecolor=None, # defaults to rc figure.facecolor edgecolor=None, # defaults to rc figure.edgecolor frameon=True, FigureClass=Figure, clear=False, **kwargs ):
可以設(shè)置圖片大小、分辨率、顏色等。
2. subplot子圖繪制,子圖的繪圖參數(shù)可以分別設(shè)置
plt.figure(1)x1 = np.linspace(-0.2, 2, 10)y1 = x1**2 + 0.3plt.subplot(121)plt.scatter(x1, y1)plt.xlabel(’X’)plt.ylabel(’Y’)plt.title(’test_1’)x2 = np.linspace(-0.2, 2, 10)y2 = x2 + 0.3plt.subplot(122)plt.plot(x2, y2, color='red', linewidth=1.0, marker = ’s’, linestyle='--')## plt.plot(x, y, color='#ef5492', linewidth=2.0, marker = ’s’, linestyle='--')# plt.plot(x2, y2, ’rs--’) plt.xlabel(’X’)plt.ylabel(’Y’)plt.title(’test_2’)plt.show()
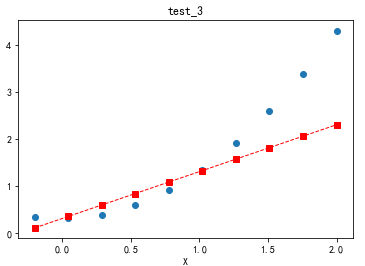
3. 在同一張圖片上顯示多種圖形,簡(jiǎn)單說(shuō)把 plt.show()放在最后即可
import matplotlib.pyplot as pltimport numpy as npplt.figure(2)x1 = np.linspace(-0.2, 2, 10)y1 = x1**2 + 0.3plt.scatter(x1, y1)x2 = np.linspace(-0.2, 2, 10)y2 = x2 + 0.3plt.plot(x2, y2, color='red', linewidth=1.0, marker = ’s’, linestyle='--')## plt.plot(x, y, color='#ef5492', linewidth=2.0, marker = ’s’, linestyle='--')# plt.plot(x2, y2, ’rs--’) plt.xlabel(’X’)plt.ylabel(’Y’)plt.title(’test_3’)plt.show()
以上就是本文的全部?jī)?nèi)容,希望對(duì)大家的學(xué)習(xí)有所幫助,也希望大家多多支持好吧啦網(wǎng)。
相關(guān)文章:
1. PHP基礎(chǔ)之流程控制3——while/do-while2. Python TestSuite生成測(cè)試報(bào)告過(guò)程解析3. python3實(shí)現(xiàn)往mysql中插入datetime類型的數(shù)據(jù)4. python爬蟲(chóng)實(shí)戰(zhàn)之制作屬于自己的一個(gè)IP代理模塊5. 簡(jiǎn)述JAVA同步、異步、阻塞和非阻塞之間的區(qū)別6. 解決AJAX返回狀態(tài)200沒(méi)有調(diào)用success的問(wèn)題7. springboot的yml配置文件通過(guò)db2的方式整合mysql的教程8. 在JSP中使用formatNumber控制要顯示的小數(shù)位數(shù)方法9. moment轉(zhuǎn)化時(shí)間戳出現(xiàn)Invalid Date的問(wèn)題及解決10. 利用單元測(cè)試對(duì)PHP代碼進(jìn)行檢查

 網(wǎng)公網(wǎng)安備