VUE+elementui組件在table-cell單元格中繪制微型echarts圖
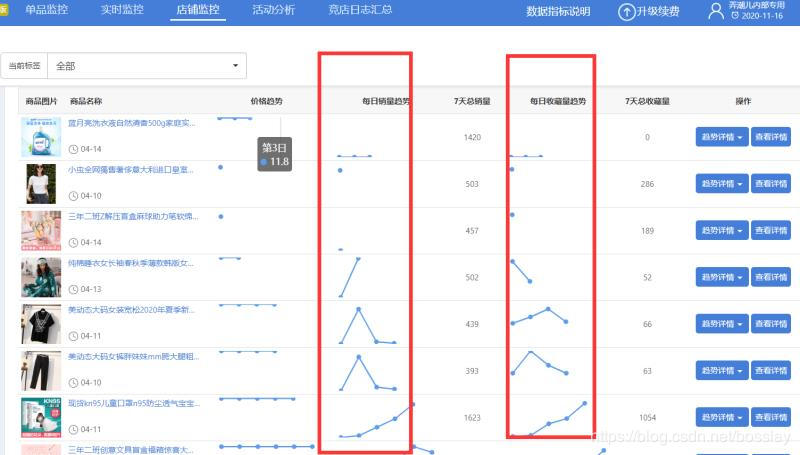
需求效果圖示例
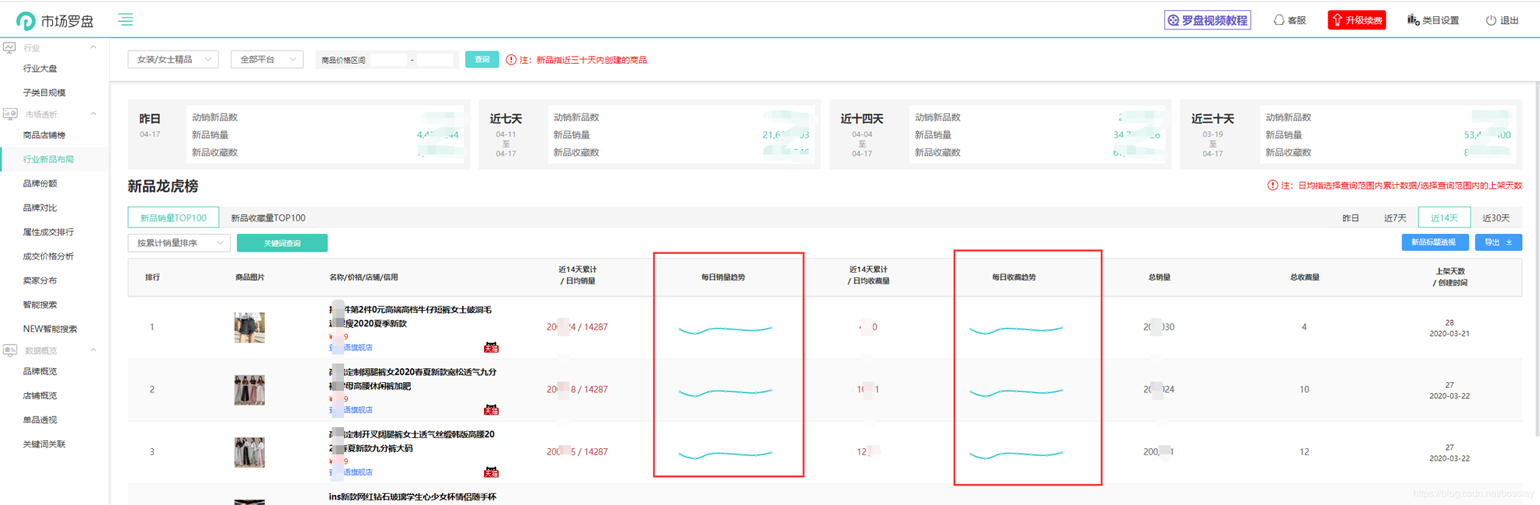
實際完成效果圖
 **
**
代碼實現(xiàn)
注:table表格為二次封裝的子組件-在table表格中 根據(jù) scope.$index動態(tài)設(shè)置元素的id ,便于指定單元格的echarts初始化;
-在單元格中觸發(fā)一個方法,傳入當(dāng)前的scope.row數(shù)據(jù)或者指定其他數(shù)據(jù),并且傳入 scope.$index 以及一個字符串便于識別當(dāng)前是哪條數(shù)據(jù)的charts
-在方法中繪制echarts**
<el-table-column align='center'> <template slot='header' slot-scope='scope'> <div v-if='tableTitle == ’sale’'> <p v-if='dateType != ’1’'>近{{ dateType }}天累計<br />/ 日均銷量 </p> <p v-if='dateType == ’1’'>昨日累計銷量</p> </div> <div v-if='tableTitle == ’fav’'> <p v-if='dateType != ’1’'>近{{ dateType }}天累計<br />/ 日均收藏量 </p> <p v-if='dateType == ’1’'>昨日累計收藏</p> </div> </template> <div slot-scope='scope' style='white-space:nowrap;'> <span class='xiao-red-color'>{{ realRowName(scope.row, ’0’) || ’-’ }}</span> <span v-if='dateType != ’1’' class='xiao-red-color'> / {{ isNaN(realRowName(scope.row, ’0’)) ? ’-’ : (realRowName(scope.row, ’0’) / (parseInt(dateType) - calcShelfTime(scope.row.real_created_time, ’0’) < 0 ? parseInt(dateType): calcShelfTime(scope.row.real_created_time, ’0’))).toFixed(0)}} </span> </div> </el-table-column> <el-table-column label='每日銷量趨勢' v-if='dateType != ’1’'> <template slot-scope='scope'> {{ drawEcharts(scope.row, scope.$index, ’sale’) }} <div : class='tiger-trend-charts'></div> </template> </el-table-column>
繪制echarts的方法(數(shù)據(jù)僅為示例,實際開發(fā)根據(jù)傳進(jìn)來的scope.row數(shù)據(jù))注意此處初始化echarts對象時采用VUE的this.$nextTick方法,以防獲取不到未渲染的節(jié)點元素。
drawEcharts() { //繪制趨勢echarts // console.log(arguments) let option = { tooltip: { trigger: ’axis’ }, // legend: { // data: [’每日30天銷量分析’] // }, grid: { left: ’10px’, right: ’30px’, top: ’40px’, bottom: ’10px’, containLabel: true }, xAxis: { show: false, type: ’category’, boundaryGap: false, data: [’03-21’, ’03-22’, ’03-23’, ’03-24’, ’03-25’, ’03-26’, ’03-27’] }, yAxis: { show: false, type: ’value’ }, series: [ { name: ’每日30天銷量分析’, type: ’line’, data: [120, 500, 101, 86, 173, 230, 6] } ] }; let chartId = ’tiger-’ + arguments[2] + ’-trend-index’ + arguments[1]; this.$nextTick(() => { let myChart = this.echarts.init(document.getElementById(chartId), ’macarons’); myChart.setOption(option); myChart.resize(); }); },
AND 不要忘記設(shè)置echarts的高度,否則一輩子也出不來圖形(示例,根據(jù)實施開發(fā)調(diào)整)
&-frame { display: flex; flex-flow: column nowrap; justify-content: space-between; .price-bar { color: red !important; } .tiger-trend-charts { height: 60px; min-width: 100px; } }
到此這篇關(guān)于VUE+elementui組件在table-cell單元格中繪制微型echarts圖的文章就介紹到這了,更多相關(guān)VUE elementui 單元格echarts圖內(nèi)容請搜索好吧啦網(wǎng)以前的文章或繼續(xù)瀏覽下面的相關(guān)文章希望大家以后多多支持好吧啦網(wǎng)!
相關(guān)文章:
1. Java類加載機(jī)制實現(xiàn)步驟解析2. python3實現(xiàn)往mysql中插入datetime類型的數(shù)據(jù)3. python爬蟲實戰(zhàn)之制作屬于自己的一個IP代理模塊4. moment轉(zhuǎn)化時間戳出現(xiàn)Invalid Date的問題及解決5. ASP動態(tài)網(wǎng)頁制作技術(shù)經(jīng)驗分享6. 存儲于xml中需要的HTML轉(zhuǎn)義代碼7. 匹配模式 - XSL教程 - 48. ASP中if語句、select 、while循環(huán)的使用方法9. ASP常用日期格式化函數(shù) FormatDate()10. html小技巧之td,div標(biāo)簽里內(nèi)容不換行
 網(wǎng)公網(wǎng)安備