Echarts自定義圖形的方法參考
目錄
- 前言
- 1.自定義圖形最后的效果是這樣的:
- 2.注冊自定義的圖形
- 3.extendShape
- 4.使用echarts注冊這三個圖形
- 5.使用自定義的形狀
- 總結
前言
在一個前端大屏項目中,有一個模塊使用到了自定義的,由三個面組成的偽3D柱形圖。在此處記錄一下,方便后續自定義的時候參考一下。涉及到了zrender里面的一些方法,還特意去zrender看了些示例和文檔。
1.自定義圖形最后的效果是這樣的:

圖形由三個面組成,需要定義三個形狀。用cubeleft,cubetop,cuberight來分別定義左側面,頂部面以及右側面。
2.注冊自定義的圖形
echarts官方文檔處:Documentation - Apache ECharts
我們需要定義一個這樣的類,然后再通過echarts來注冊這個類,后續就可以通過類名來使用了。
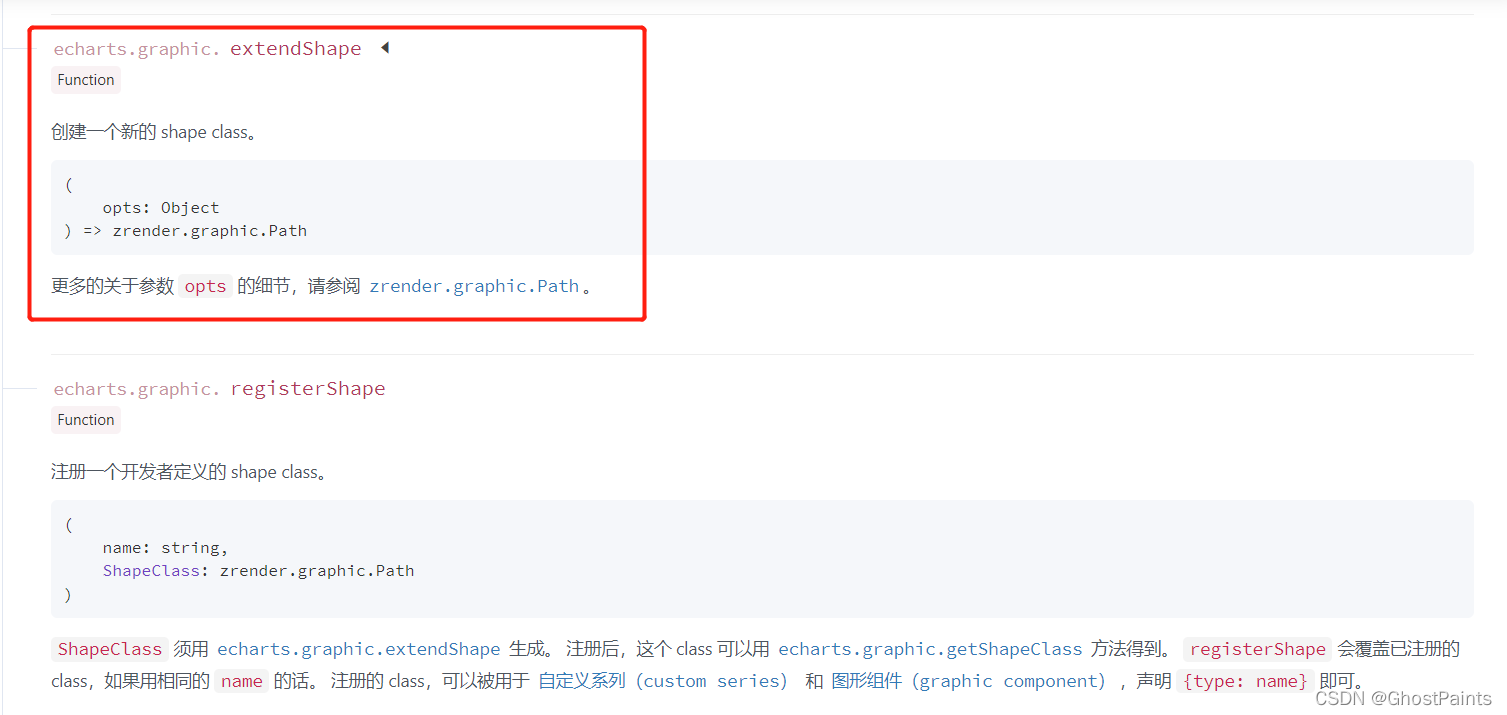
3.extendShape
// 繪制左側面 const CubeLeft = echarts.graphic.extendShape({ shape: {x: 0,y: 0 }, buildPath: function(ctx, shape) {const xAxisPoint = shape.xAxisPointconst c0 = [shape.x, shape.y]const c1 = [shape.x - 13, shape.y - 13]const c2 = [xAxisPoint[0] - 13, xAxisPoint[1] - 13]const c3 = [xAxisPoint[0], xAxisPoint[1]]ctx.moveTo(c0[0], c0[1]).lineTo(c1[0], c1[1]).lineTo(c2[0], c2[1]).lineTo(c3[0], c3[1]).closePath() } }) // 繪制右側面 const CubeRight = echarts.graphic.extendShape({ shape: {x: 0,y: 0 }, buildPath: function(ctx, shape) {const xAxisPoint = shape.xAxisPointconst c1 = [shape.x, shape.y]const c2 = [xAxisPoint[0], xAxisPoint[1]]const c3 = [xAxisPoint[0] + 18, xAxisPoint[1] - 9]const c4 = [shape.x + 18, shape.y - 9]ctx.moveTo(c1[0], c1[1]).lineTo(c2[0], c2[1]).lineTo(c3[0], c3[1]).lineTo(c4[0], c4[1]).closePath() }}) // 繪制頂面 const CubeTop = echarts.graphic.extendShape({ shape: {x: 0,y: 0 }, buildPath: function(ctx, shape) {const c1 = [shape.x, shape.y]const c2 = [shape.x + 18, shape.y - 9]const c3 = [shape.x + 5, shape.y - 22]const c4 = [shape.x - 13, shape.y - 13]ctx.moveTo(c1[0], c1[1]).lineTo(c2[0], c2[1]).lineTo(c3[0], c3[1]).lineTo(c4[0], c4[1]).closePath() } })這段代碼主要是看buildpath如何使用,zrender的官方文檔中,并沒有直接告訴這個方法的兩個參數是干什么用的,只給了一個示例,從這個示例中,可以知道這兩個參數具體怎么用。
示例網址:https://github.com/ecomfe/zrender/blob/master/test/pin.html
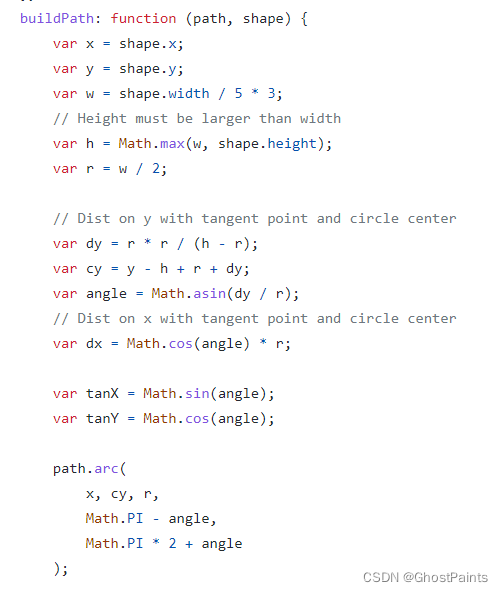
第一個參數是path,第二參數是shape。path可以理解為一個canvas中的繪制畫筆,可以設置路徑并且閉合路徑。
第二個參數在echarts中,是自定義的custom傳遞過來的,因此可以通過這個對象獲取到我們一個很熟悉的屬性 xAxisPoint。
繪制的兩個面中,只有左側和右側面需要有填充高度,頂部不需要,所以頂部的形狀就沒有使用xAxisPoint這個屬性。
這也是很好理解的,因為我們自定義的偽圓柱體里面的填充物肯定是有一個高度的。填充多少根據我們的數據來知道,讓它看起來確實是被某種東西從底部開始增多填充了。
拿比較簡單的頂部來舉例:
buildPath: function(ctx, shape) { const c1 = [shape.x, shape.y] const c2 = [shape.x + 18, shape.y - 9] const c3 = [shape.x + 5, shape.y - 22] const c4 = [shape.x - 13, shape.y - 13] ctx.moveTo(c1[0], c1[1]).lineTo(c2[0], c2[1]).lineTo(c3[0], c3[1]).lineTo(c4[0],c4[1]).closePath()}繪制的四邊形,其實就是四個頂點,我們只需要用moveTo來控制路徑就行,在最后那個點進行閉合就行。偏移量是固定的值,可以根據情況自己去設置不同的值來扭曲這個四邊形。
其中c1是底部的頂點,c2是右側的頂點,c3是頂部的頂點,c4是右側的頂點。其他兩個面也是類似的。
4.使用echarts注冊這三個圖形
// 注冊三個面圖形 echarts.graphic.registerShape("CubeLeft", CubeLeft) echarts.graphic.registerShape("CubeRight", CubeRight) echarts.graphic.registerShape("CubeTop", CubeTop)5.使用自定義的形狀
其他的數據都和正常使用echarts一樣,不同的地方在于series的配置。
series數組中,總共放置二個對象。第一個對象如下:
{type: "custom",renderItem: function(params, api) { const location = api.coord([api.value(0), api.value(1)]) return {type: "group",children: [{ type: "CubeLeft", shape: {api,x: location[0],y: location[1],xAxisPoint: api.coord([api.value(0), 0]) }, style: {fill: "rgba(47,102,192,.27)",stroke: "black" }, z2: 999}, { type: "CubeRight", shape: {api,x: location[0],y: location[1],xAxisPoint: api.coord([api.value(0), 0]) }, style: {fill: "rgba(59,128,226,.27)",stroke: "black" }, z2: 999}, { type: "CubeTop", shape: {api,x: location[0],y: location[1],xAxisPoint: api.coord([api.value(0), 0]) }, style: {fill: "rgba(72,156,221,.27)",stroke: "black" }, z2: 999}] }},data: MAX}最主要的還是renderItem里面的邏輯,這個方法返回一個對象,對象就是我們自定義的一個group組。renderItem可以返回的對象在文檔中都有說明:Documentation - Apache ECharts
我們定義的那三個面,需要把它看成一個整體,所以renderItem返回的是一個類型為group的對象,另外三個形狀作為children保存在數組中。
其中的shape參數,會在buildpath中使用到。
style中設置了它的填充顏色和邊框線顏色。然后使用z2定義這個echarts的顯示層級為最上級。如果不使用它,下面用于填充的會將其遮擋住。
這里也只是定義了第一個自定義的形狀,也就是最外層的那個偽3d柱體。第二個自定義形狀是要填充的形狀。
{type: "custom",renderItem: (params, api) => { const location = api.coord([api.value(0), api.value(1)]) var color = new echarts.graphic.LinearGradient(0, 0, 0, 1, [{offset: 1,color: "#FEFD53" }, {offset: 0,color: "#f7c824" }] ); return {type: "group",children: [{ type: "CubeLeft", shape: {api,xValue: api.value(0),yValue: api.value(1),x: location[0],y: location[1],xAxisPoint: api.coord([api.value(0), 0]) }, style: {fill: color,stroke: "red" }}, { type: "CubeRight", shape: {api,xValue: api.value(0),yValue: api.value(1),x: location[0],y: location[1],xAxisPoint: api.coord([api.value(0), 0]) }, style: {fill: color,stroke: "red" }}, { type: "CubeTop", shape: {api,xValue: api.value(0),yValue: api.value(1),x: location[0],y: location[1],xAxisPoint: api.coord([api.value(0), 0]) }, style: {fill: color,stroke: "red" }}] }},data: VALUE}內部填充的圖形,使用了一個線性漸變的顏色用來填充。邊框線使用紅色。與第一個不同的是,style里面的風格,以及data使用的數據。這里的data使用value具體的數值。而外殼的圖形使用的數據是max最大值。這樣就會有一個漸變顏色填充的紅色邊框圖形,填充到了一個黑色邊框的柱體中。
這樣就自定義好了一個視覺上的3d柱體形狀的圖表了。
總結
到此這篇關于Echarts自定義圖形的文章就介紹到這了,更多相關Echarts自定義圖形內容請搜索以前的文章或繼續瀏覽下面的相關文章希望大家以后多多支持!

 網公網安備
網公網安備