Prometheus監控Springboot程序的實現方法
我本次使用的Springboot版本為1.5.12.RELEASE,如果是Springboot2.0+,那么監控的配置以及吐出的監控指標會有所不同。添加maven依賴,pom文件配置如下:
<dependency> <groupId>io.prometheus</groupId> <artifactId>simpleclient_spring_boot</artifactId> <version>${prometheus.client.version}</version> </dependency> <dependency> <groupId>io.prometheus</groupId> <artifactId>simpleclient</artifactId> <version>${prometheus.client.version}</version> </dependency> <dependency> <groupId>io.prometheus</groupId> <artifactId>simpleclient_hotspot</artifactId> <version>${prometheus.client.version}</version> </dependency>
其中Prometheus的版本號為:
<prometheus.client.version>0.5.0</prometheus.client.version>2. 修改配置文件
修改application.properties配置文件,添加如下內容:
server.port=8080# 啟用基礎認證security.basic.enabled = false# 安全路徑列表,逗號分隔,此處只針對/admin路徑進行認證security.basic.path = /admin# 認證使用的用戶名security.user.name = admin# 認證使用的密碼。 默認情況下,啟動時會記錄隨機密碼。security.user.password = 123456# 可以訪問管理端點的用戶角色列表,逗號分隔management.security.roles = SUPERUSER# actuator暴露接口使用的端口,為了和api接口使用的端口進行分離management.port = 8099# actuator暴露接口的前綴management.context-path = /admin# actuator是否需要安全保證management.security.enabled = false# actuator的metrics接口是否需要安全保證endpoints.metrics.sensitive = false# actuator的metrics接口是否開啟endpoints.metrics.enabled=true# actuator的health接口是否需要安全保證endpoints.health.sensitive=false# actuator的health接口是否開啟endpoints.health.enabled=true
application.yml 配置如下:
# actuator是否需要安全保證management.security.enabled: falseendpoints: metrics: # actuator的metrics接口是否需要安全保證 sensitive: false # actuator的metrics接口是否開啟 enabled: true health: # actuator的health接口是否需要安全保證 sensitive: false # actuator的health接口是否開啟 enabled: true3. 啟用Prometheus監控
在Springboot啟動類上添加注解@EnablePrometheusEndpoint,同時使用simpleclient_hotspot中提供的DefaultExporter該Exporter會在metrics endpoint中放回當前應用JVM的相關信息
@SpringBootApplication@EnablePrometheusEndpoint@EnableSpringBootMetricsCollectorpublic class CaseApplication implements CommandLineRunner { public static void main(String[] args) { SpringApplication.run(CaseApplication.class, args); } @Override public void run(String... strings) throws Exception { DefaultExports.initialize(); }}4. 監控埋點4.1 新建攔截器
建立一個攔截器,用來攔截URL。
public class PrometheusMetricsInterceptor implements HandlerInterceptor { private Histogram.Timer histogramRequestTimer; private Histogram.Timer nacosTimer; private Histogram.Child nacosChild; static final Histogram requestLatencyHistogram = Histogram.build().labelNames('path', 'method', 'code') .name('io_namespace_http_requests_latency_seconds_histogram').help('Request latency in seconds.') .register(); @Override public boolean preHandle(HttpServletRequest request, HttpServletResponse response, Object handler) throws Exception { System.out.println('-------Histogram--------'); histogramRequestTimer = requestLatencyHistogram .labels(request.getRequestURI(), request.getMethod(), String.valueOf(response.getStatus())) .startTimer(); nacosTimer = MetricsMonitor.getConfigRequestMonitor(request.getMethod(), request.getRequestURI(), String.valueOf(response.getStatus())); nacosChild = MetricsMonitor.getNamingRequestMonitor(request.getMethod(), request.getRequestURI(), String.valueOf(response.getStatus())); return true; } @Override public void postHandle(HttpServletRequest request, HttpServletResponse response, Object handler, ModelAndView modelAndView) throws Exception { } @Override public void afterCompletion(HttpServletRequest request, HttpServletResponse response, Object handler, Exception ex) throws Exception { histogramRequestTimer.observeDuration(); nacosTimer.observeDuration(); nacosChild.startTimer(); }}4.2 注冊攔截器
新建攔截器后需要注冊到服務中才可以攔截URL。
@Configurationpublic class WebServletContextConfiguration extends WebMvcConfigurationSupport { @Override public void addInterceptors(InterceptorRegistry registry) { registry.addInterceptor(getInterceptor()).addPathPatterns('/**'); super.addInterceptors(registry); } @Bean public HandlerInterceptor getInterceptor() { return new PrometheusMetricsInterceptor(); }}5. 驗證監控
啟動應用程序,訪問地址http://localhost:8099/admin/prometheus,驗證是否存在監控指標。

普羅米修斯客戶端庫提供了四種核心度量類型。目前,它們只在客戶端庫(為了使api能夠根據特定類型的使用而定制)和wire協議中有所區別。Prometheus服務器還沒有利用類型信息,并將所有數據壓縮成無類型的時間序列。這種情況在未來可能會改變。
6.1 Counter計數器是一個累積度量,它表示一個單調遞增的計數器,其值在重新啟動時只能遞增或重置為零。例如,您可以使用計數器來表示服務的請求、完成的任務或錯誤的數量。不要使用計數器來暴露可能降低的值。例如,不要為當前正在運行的進程的數量使用計數器;而是使用量規。示例代碼:
import io.prometheus.client.Counter;class YourClass { static final Counter requests = Counter.build() .name('requests_total').help('Total requests.').register(); void processRequest() { requests.inc(); // Your code here. }}6.2 Gauge
量規是一個度量單位,它表示一個可以任意上下移動的數值。壓力表通常用于測量溫度或當前內存使用情況等測量值,但也用于“計數”,比如并發請求的數量。示例代碼:
class YourClass { static final Gauge inprogressRequests = Gauge.build() .name('inprogress_requests').help('Inprogress requests.').register(); void processRequest() { inprogressRequests.inc(); // Your code here. inprogressRequests.dec(); }}6.3 Histogram
直方圖對觀察結果(通常是請求持續時間或響應大小之類的東西)進行采樣,并在可配置的桶中計數。它還提供所有觀測值的和。示例代碼:
class YourClass { static final Histogram requestLatency = Histogram.build() .name('requests_latency_seconds').help('Request latency in seconds.').register(); void processRequest(Request req) { Histogram.Timer requestTimer = requestLatency.startTimer(); try { // Your code here. } finally { requestTimer.observeDuration(); } }}6.4 Summary
與柱狀圖類似,摘要對觀察結果進行采樣(通常是請求持續時間和響應大小之類的內容)。雖然它還提供了觀察值的總數和所有觀察值的總和,但它計算了一個滑動時間窗口上的可配置分位數。
class YourClass { static final Summary receivedBytes = Summary.build() .name('requests_size_bytes').help('Request size in bytes.').register(); static final Summary requestLatency = Summary.build() .name('requests_latency_seconds').help('Request latency in seconds.').register(); void processRequest(Request req) { Summary.Timer requestTimer = requestLatency.startTimer(); try { // Your code here. } finally { receivedBytes.observe(req.size()); requestTimer.observeDuration(); } }}6.5 自定義Collector
有時不可能直接測試代碼,因為它不在您的控制范圍內。這要求您代理來自其他系統的指標。為此,您需要創建一個自定義收集器(需要將其注冊為普通度量)。
class YourCustomCollector extends Collector { List<MetricFamilySamples> collect() { List<MetricFamilySamples> mfs = new ArrayList<MetricFamilySamples>(); // With no labels. mfs.add(new GaugeMetricFamily('my_gauge', 'help', 42)); // With labels GaugeMetricFamily labeledGauge = new GaugeMetricFamily('my_other_gauge', 'help', Arrays.asList('labelname')); labeledGauge.addMetric(Arrays.asList('foo'), 4); labeledGauge.addMetric(Arrays.asList('bar'), 5); mfs.add(labeledGauge); return mfs; }}// Registrationstatic final YourCustomCollector requests = new YourCustomCollector().register()7. 安裝配置Prometheus7.1 安裝配置
下載安裝包
wget https://github.com/prometheus/prometheus/releases/download/v2.12.0/prometheus-2.12.0.linux-amd64.tar.gz
解壓文件
tar -zxvf prometheus-2.12.0.linux-amd64.tar.gz
修改配置文件prometheus.yml采集Nacos metrics數據。配置監控的job以及目標服務器,每一個目標服務器都是一個實例。
cd prometheus-*

后臺啟動Prometheus服務,并出到日志。
./prometheus --config.file=prometheus.yml > prometheus.log 2>&1 &
通過訪問http://{ip}:9090/graph可以看到prometheus的采集數據,在搜索欄搜索監控指標,例如:nacos_monitor可以搜索到Nacos數據說明采集數據成功
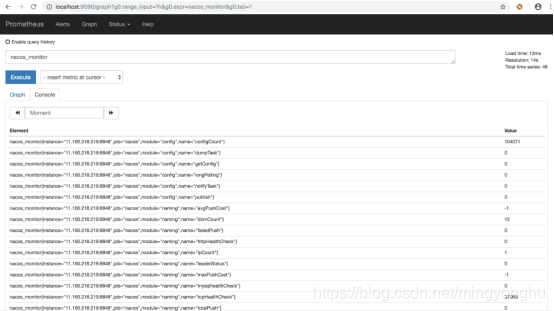
在查詢條件框中輸入表達式,進行統計。例如:
sum(rate(nacos_client_request_seconds_count{url=~’/dialog/slu/nlp/parser’, instance=~’39.97.161.102:30315|39.97.161.102:30316’}[1m])) by (method,url,instance)
結果如下圖:

安裝grafana,下載安裝包
wget https://dl.grafana.com/oss/release/grafana-6.5.2.linux-amd64.tar.gztar -zxvf grafana-6.5.2.linux-amd64.tar.gz
修改端口配置,復制一個配置文件,后續修改基于該自定義配置文件修改,不需要修改原始文件。
cd grafana-6.5.2/confcp sample.ini custom.inivi custom.ini
可以在該配置文件中修改端口號

訪問grafana: http://{ip}:3000,用戶名密碼默認為:admin/admin。

登錄時提示修改默認密碼,如果不想修改可以跳過。
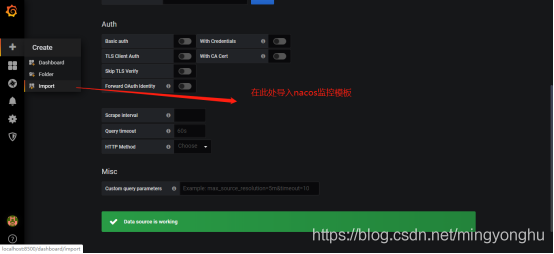
8.2 配置數據源


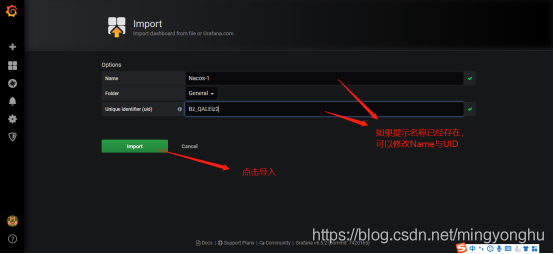
監控面板可以自己配置,也可以通過導入json文件來進行修改,推薦使用配置好的json文件,修改起來會非常方便。

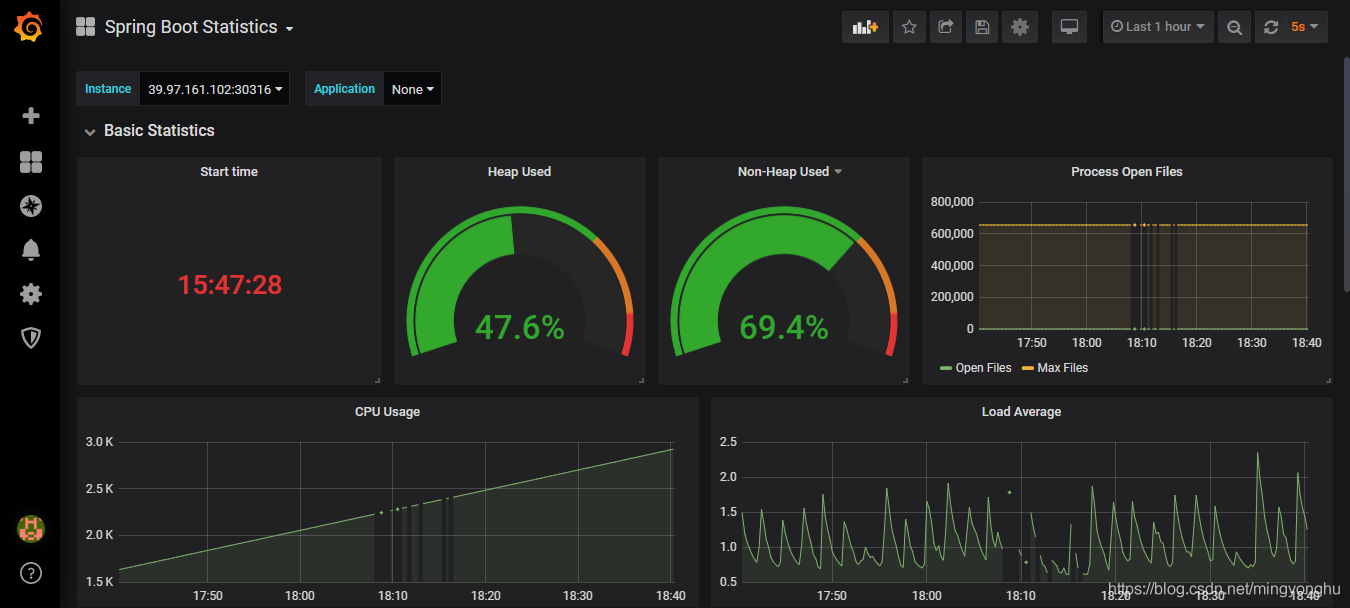
修改后的展示效果如圖所示:
注:此處grafana的模板文件是從別處下載的,可以根據需要導入自己的模板文件。
9. 參考文獻SpringBoot 應用監控踩坑集錦
prometheus docs
到此這篇關于Prometheus監控Springboot程序的實現方法的文章就介紹到這了,更多相關Prometheus監控Springboot內容請搜索好吧啦網以前的文章或繼續瀏覽下面的相關文章希望大家以后多多支持好吧啦網!
相關文章:

 網公網安備
網公網安備